Red hues
|
Standard Colors
Here are scanned about 20 percent of the paint chips from a chart of standardized colors used for rocks, but applicable to other natural materials and objects. By way of explanation, some of the text for the Rock Color Chart is included below.
The Munsell system is the most widely accepted system of color identification in use in the United States. This system is based on a color solid, or approximately a color sphere, which has a neutral gray central axis grading from white at the top to black at the bottom. This property of lightness is called value. Around the circumference or equator of the solid are the ten major hues, each of which is divided into ten numbered divisions, so that 5 marks the middle of the hue, and 10 marks the boundary between one hue and the next. Thus, any particular hue can be designated by a number and a letter such as 5R or 10YR. Any single vertical section through the neutral gray axis and a particular hue constitutes a color chart on which the colors grade in value from light at the top to dark at the bottom, and in chroma (degree of saturation) from gray at one edge to the most vivid colors out at the margin. Both value and chroma are numbered so any particular color can be given a numerical designation representing hue, value, and chroma such as 5R 6/4 and 10YR 8/2. ... Color names have been taken from the Inter-Society Color Council-National bureau of Standards system of names, inasmuch as the system is already widely used by organizations interested in color.... It was found by experiment that wetting the specimen merely decreases the value, that is, makes the specimen darker, but does not change the chroma.
Each chip is shown in two versions, a small "raw" image, which represents the scan as it came off the Microtek X6 scanner, and a larger image which has been "enhanced" in a way similar to most of the images on the rest of the Freshwater Molluscan Shells site, to give a result that appears pleasing on the computer screen. The scanner software has controls of its own, left on its "default" settings.
The enhancement process involved increasing the brightness, contrast, and the amount of red in the image, but varied from case to case. I used "Photoimpact", which has many of the capabilities of Adobe "Photoshop" image processing software. The actual color one perceives when comparing the color chips in the book with colors on the screen is a function of the lighting in the room, as the chips reflect from ambient light, while the computer screen fluoresces with its own. Colors seen on another monitor will be a function of the software, display, and monitor settings as well as surrounding ambient colors and lighting. The eye naturally compensates for these things to give us a view of the world in relative color. This is why color photographs taken under incandescent light appear brownish, while those taken in the shade under open sky will appear bluish without special filters and appropriate film. When compared to colors from the Munsell software, the raw scanned images were often truer than the "enhanced," so one might consider the latter to represent objects as having been brought out from the scanner's cold fluorescent reality into warm incandescent light.
Typical RGB color values are included for the scanned images. They vary in a small range over the image of each chip. Also included are cells with the background set to that color taken from Munsell software, along with the decimal numeric values it gives. Please visit http://www.Munsell.com/ for the software gratis.
Red hues
|
Orange hues
|
Yellow hues
|
Greens and yellow greens
|
Blue, green, and purple hues
|
Low
chroma grays. I have included colors off
|
scanned color chips from:
ROCK-COLOR CHART
[no copyright]
Prepared by
THE ROCK-COLOR CHART COMMITTEE
.....
1948
Distributed by
THE GEOLOGICAL SOCIETY OF AMERICA, BOULDER, COLORADO
Reprinted 1951, 1963, 1970, 1975, 1979
The arrangement of chips in a later 1991
version is copyrighted. New ones are available at
http://granite.geosociety.org/bookstore/
http://www.geosociety.org/
Scanner Distortion
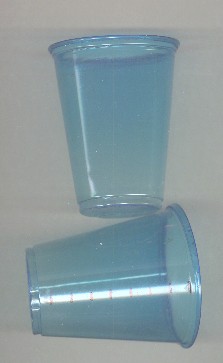
The scanning of three-dimensional objects introduces a distortion not discussed elsewhere. These images were made with the same scanner, as above. They were not rotated. The light and sensing element is oriented horizontally, and moves from top to bottom. Flat bed scanners have a substantial depth of focus, but suffer from a peculiar lateral compression at a distance greater than a few cm. This is caused by the optics and geometry of the CCD sensing array, where elements sample light radially outward from a more central location, so that a more distant object intersects fewer of their lines of sight. Both blurring and distortion become substantial at 5 cm when 50 pixels/inch resolution is used, and unacceptable much beyond that. Fortunately, most specimens are not large, and those that are can be photographed with a digital or film camera.
\/ \/ \/ \/ \/
*****************************************************
\/ \/ \/ \/ \/
 |
 |
|
| Small
transparent plastic cups, marks on lower one are cm. |
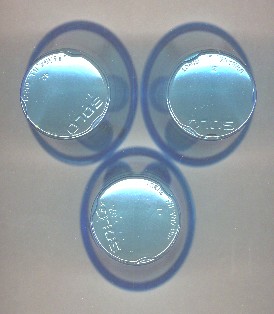
Scanned
view from base of cups. Both ends are round! |
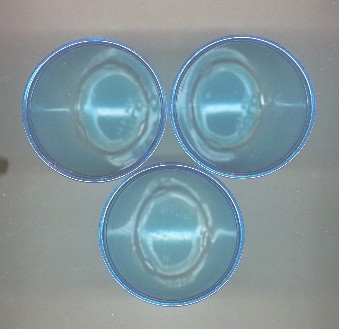
Scanned view looking into cups. Diameter is 7.3
cm, 2.95 in.